Table of Contents
- Introduction
- Descriptive Analysis
- Principal Components Analysis
- Correlation between components
- Conclusion
Introduction
Please refer to the Introduction of “World Happiness Report - A Cluster Analysis [1/2]” as this is the second part of this work.
Descriptive Analysis
Please refer to the Descriptive Analysis of “World Happiness Report - A Cluster Analysis [1/2]” as this is the second part of this work.
Outliers
Please refer to the outliers detection in the “World Happiness Report - A Cluster Analysis [1/2]” as this is the second part of this work.
Principal Components Analysis
- Standardize the data (z-score)
- Correlation matrix (using the Pearson test), where the correlation matrix and the identity matrix are compared
- Bartlett test, checks if there is any difference among the variances (H0 states that the variances are the same)
| chisq | p-value | degrees of freedom |
|---|---|---|
| 313.0526 | 6.729122e-46 | 36 |
Since the p-value is very low (<0.05), there is no proof to say that the correlation matrix is the same as the identity matrix. The null hypothesis is not accepted. This means that the variables are correlated so we can go on with the analysis.
Eigenvalues
Using the Principal components analysis function, the eigenvalues are calculated:
| components | eigenvalue | percentage of variance cumulative | percentage of variance |
|---|---|---|---|
| comp 1 | 4.6181826 | 51.313140 | 51.31314 |
| comp 2 | 1.7267115 | 19.185684 | 70.49882 |
| comp 3 | 1.0142289 | 11.269211 | 81.76803 |
| comp 4 | 0.5323246 | 5.914717 | 87.68275 |
| comp 5 | 0.4069073 | 4.521193 | 92.20394 |
| comp 6 | 0.2331299 | 2.590332 | 94.79428 |
| comp 7 | 0.1853060 | 2.058956 | 96.85323 |
| comp 8 | 0.1547838 | 1.719821 | 98.57305 |
| comp 9 | 0.1284253 | 1.426948 | 100.00000 |
The first three components have an eigenvalue > 1 and together have the 81% of total cumulative variance. Using three components for the analysis is then the recommendation.
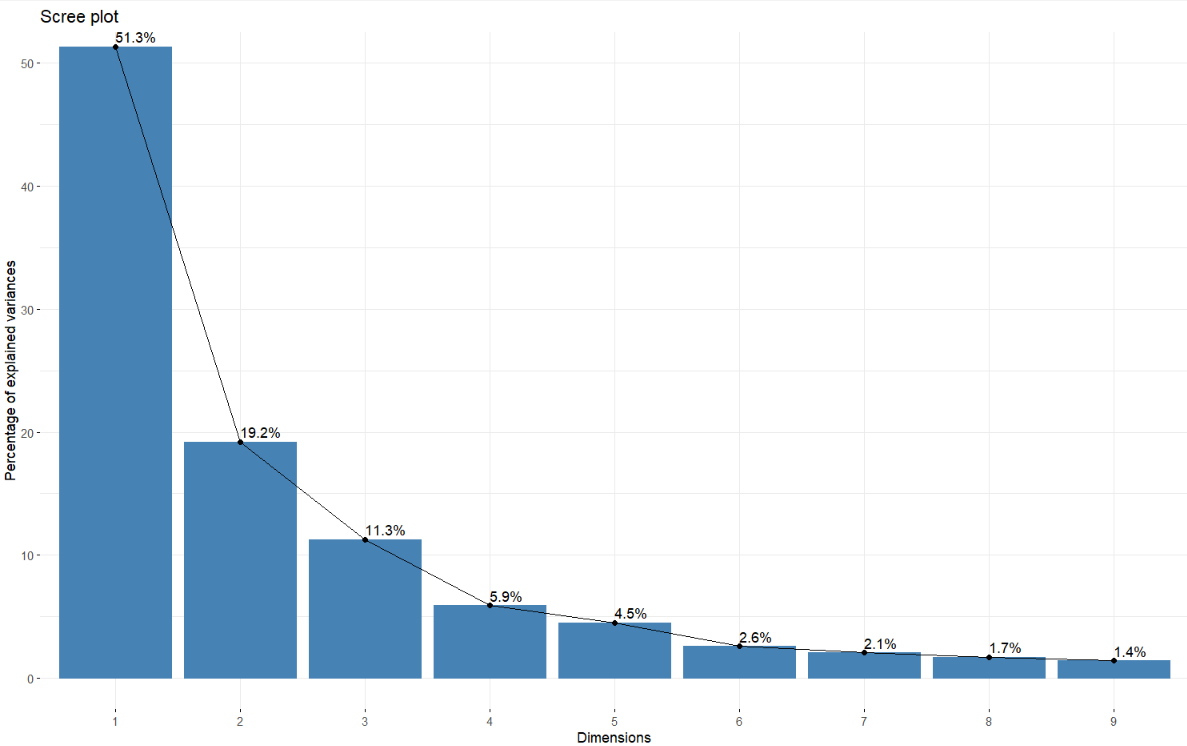
In this screeplot is shown how the graph starts to fall straight after the third component. Therefore, three components will be used for the analysis.
Loadings (cargas factoriales)
| Variables | Comp.1 | Comp.2 | Comp.3 |
|---|---|---|---|
| Life ladder | 0.432 | N/A | N/A |
| log GDP per capita | 0.371 | 0.370 | N/A |
| Social support | 0.333 | 0.280 | 0.431 |
| Healthy life expectancy | 0.303 | 0.335 | -0.379 |
| Freedom to make life choices | 0.257 | -0.486 | N/A |
| Perception of corruption | -0.392 | 0.199 | 0.294 |
| Positive affect | 0.155 | -0.559 | 0.295 |
| Negative affect | -0.345 | N/A | -0.538 |
| Confidence in national goverment | 0.331 | -0.274 | -0.445 |
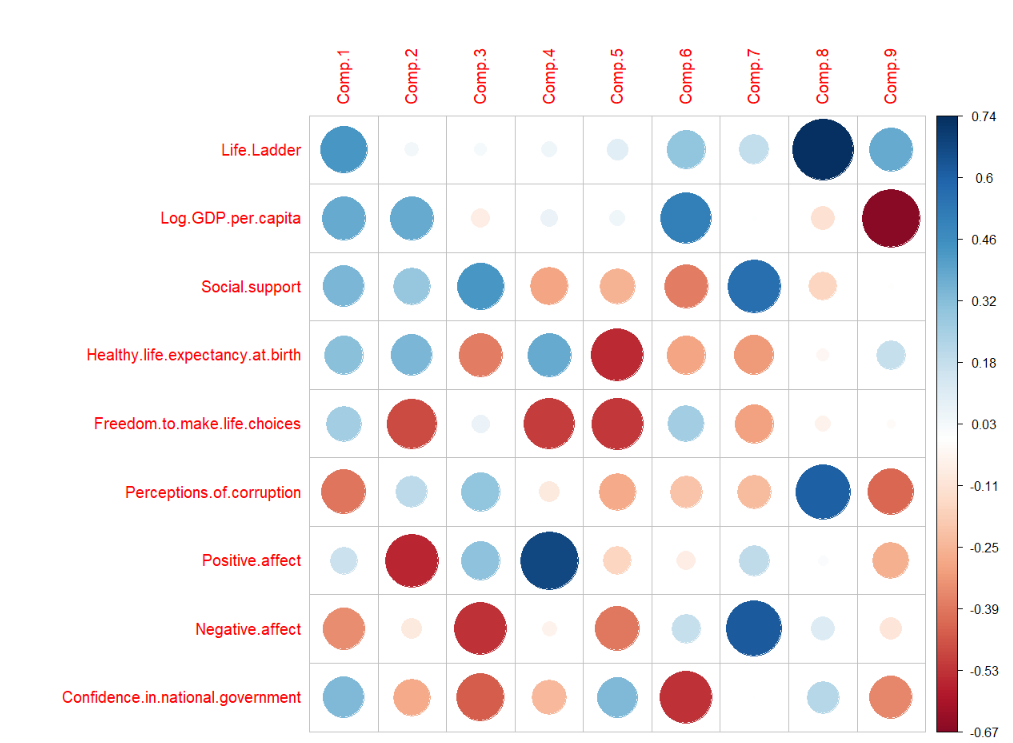
Given the correlation between the variable and the components, these groups are defined:
| First component | Second component | Third component |
|---|---|---|
| Quality of life | Economy and Corruption | Social support and Corruption |
Correlation between components
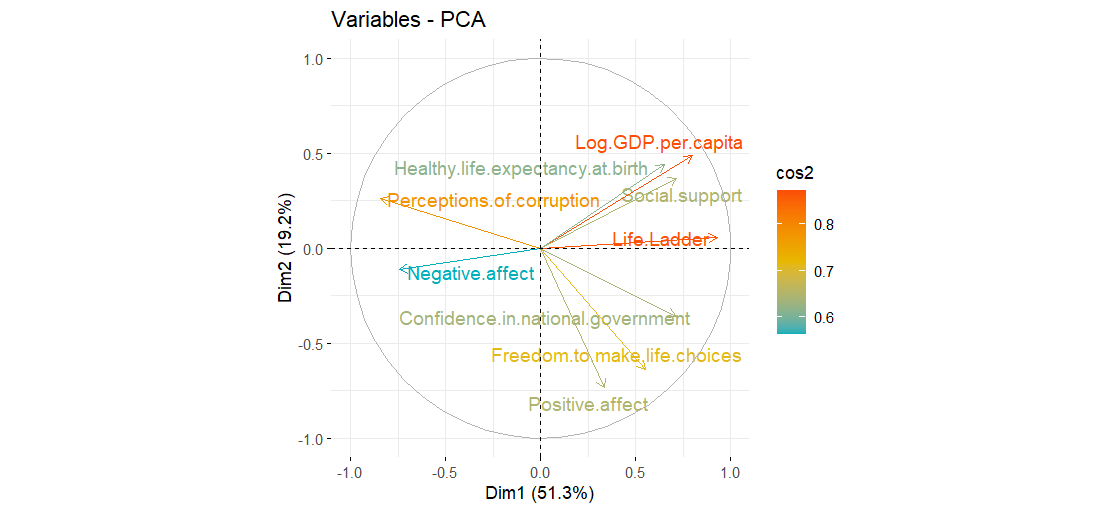
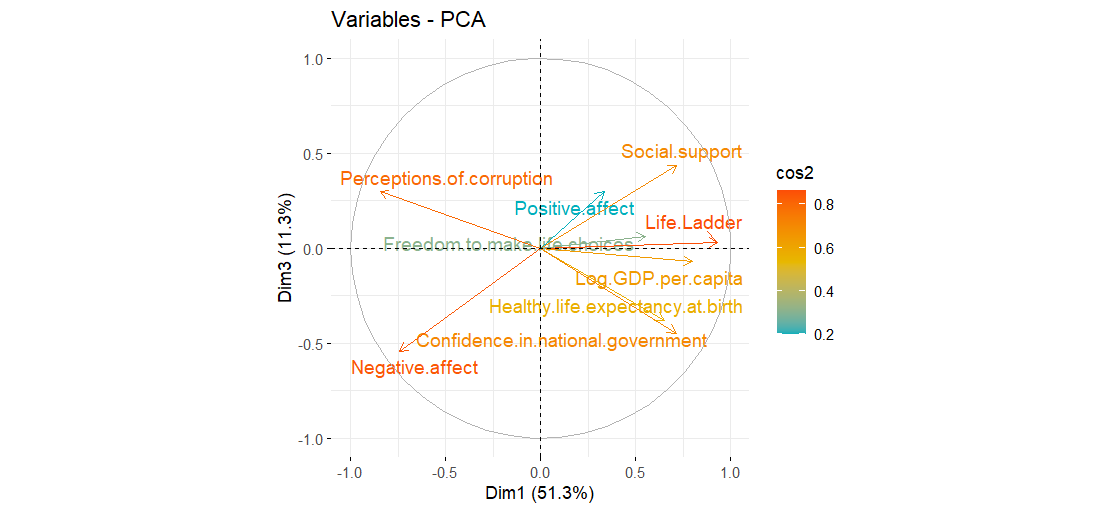
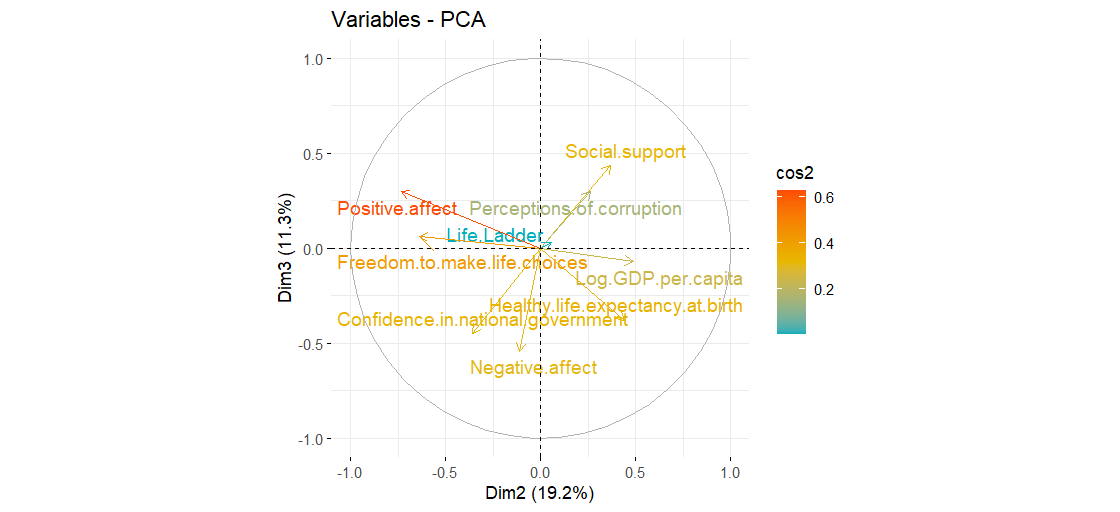
COS2 how well a variable is represented in a component.
- The closer the variables arrow with each other, the more correlated are the variables.
- The closer the variables arrow to the circumference, the more are significant to the components (x or y depending on the axis).
Components 1 (Quality of Life) and 2 (Economy-Corruption)
| On Component 1: | On Component 2 |
|---|---|
| Biggest influence: log GDP per capita, Life ladder | log GDP per capita, Positive affect |
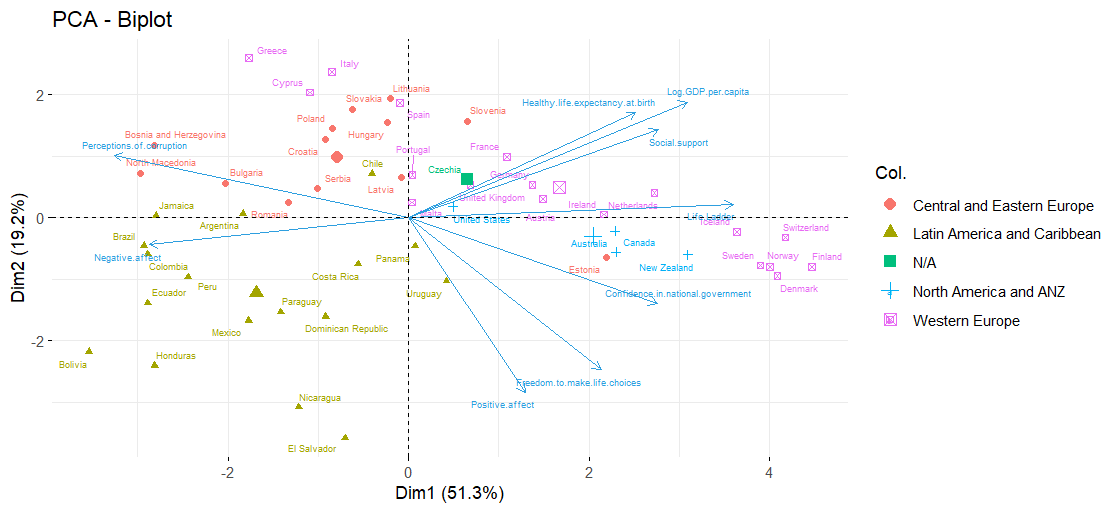
- Best Quality of life & Economy (perceived as corrupted): the Netherlands
- Best Quality of life & Economy: Scandivinian countries and Switerzland
- Worst Quality of life & Economy: Bolivia, El Salvador
Components 1 (Quality of Life) and 3 (Social Support-Corruption)
| On Component 1: | On Component 3 |
|---|---|
| log GDP per capita, Life ladder, Negative affect, Perception of corruption | Negative affect, Social support, Confidence in the government |
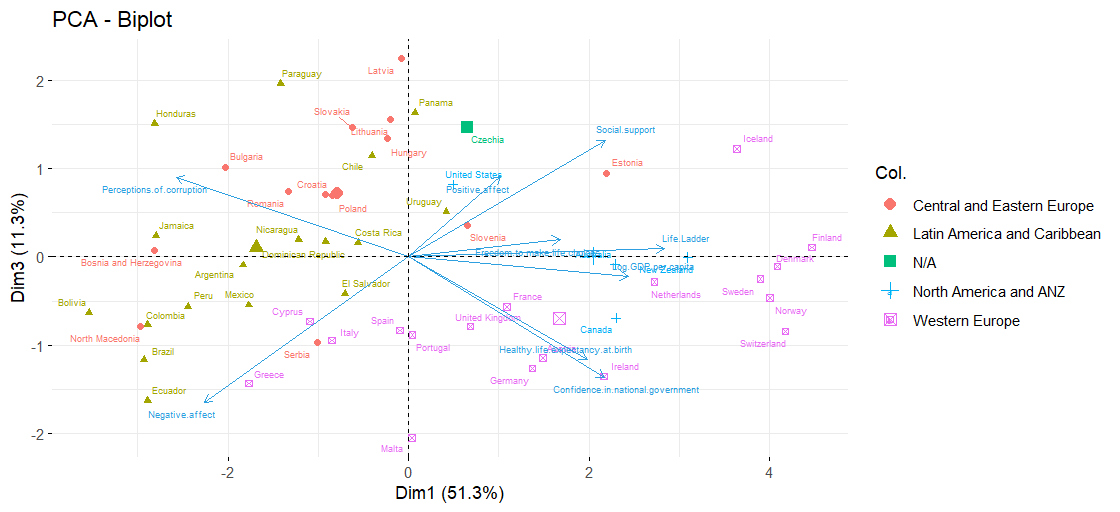
- Best Social support & Quality of life: Iceland, Finland
- Best Quality of life: Scandinivian countries, Switerzland
- Best Social support: Latvia, Panama
- Worst Social support & Quality of life: Bolivia, Ecuador
Components 2 (Economy-Corruption) and 3 (Social Support-Corruption)
| On Component 2: | On Component 3 |
|---|---|
| Positive affect, Freedom to make life choices | Negative affect, Social support, Confidence in the government |
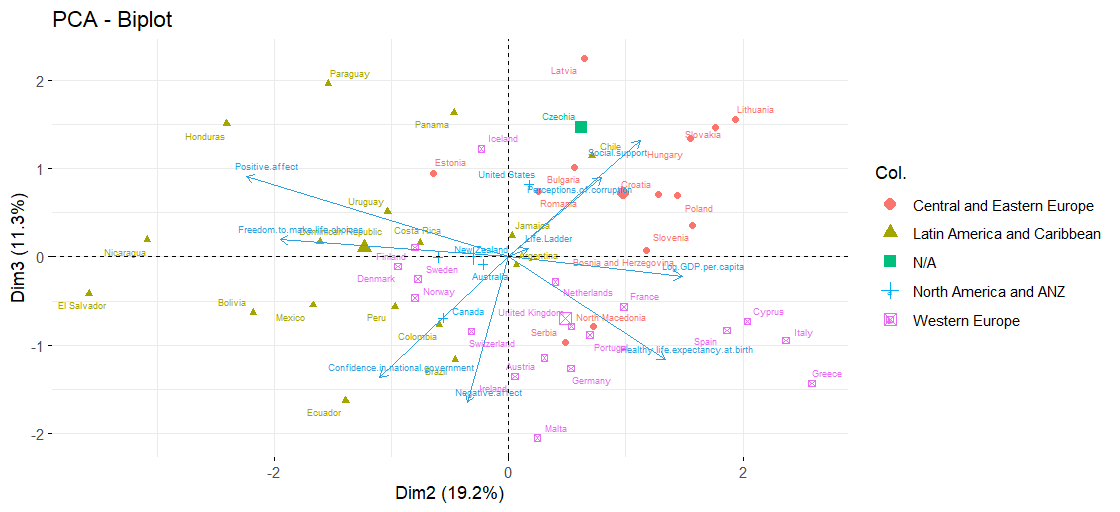
- Best Social Support & Economy (albeit perceived as corrupted): Lithuania, Latvia
- Worst Social Support & Economy: El Salvador, Ecuador
Conclusion
The analysis confirms that Nordic countries and Switerzland are the countries that score best and the Latin American countries El Salvador, Ecuador and Bolivia appear to be the worst ranked.