Table of Contents
Introduction
Language used: R
Database used: The World Happiness report from 2021 which is a global survey data to report how people evaluate their own lives in more than 150 countries worldwide.
| Packages used: |
|---|
| dplyr: to obtain a general descriptive analysis of the data. |
| corrplot: to create correlation matrix |
| readxl: to import the database (.csv) |
| HMISC: to get descriptive values of the data |
| plotly: to create interactive graphs |
| STATS: to calculate distances and define the optimal n. of clusters |
Out of the variables available, ten were chosen to work on this project. Descriptions taken from: https://happiness-report.s3.amazonaws.com/2021/Appendix1WHR2021C2.pdf
| Variables used: |
|---|
| Country: name of the country |
| Region: region to which the country belongs (Western Europe, Latin America and Caribbean, etc.) |
| Life Ladder: Happiness score or subjective well-being |
| Log GDP per capita: The statistics of GDP per capita (variable name gdp) in purchasing power parity (PPP) at constant 2017 international dollar prices are from the World Development Indicators (WDI). |
| Social support: (or having someone to count on in times of trouble) is the national average of the binary responses (either 0 or 1) to the GWP question “If you were in trouble, do you have relatives or friends you can count on to help you whenever you need them, or not? |
| Healthy life expectancy at birth: Healthy life expectancies at birth are based on the data extracted from the World Health rganization’s (WHO) Global Health Observatory data repository |
| Freedom to make life choices: is the national average of responses to the GWP question “Are you satisfied or dissatisfied with your freedom to choose what you do with your life? |
| Perceptions of corruption: is the national average of the survey responses to two questions in the GWP: “Is corruption widespread throughout the government or not” and “Is corruption widespread within businesses or not?” The overall perception is just the average of the two 0-or-1 responses. |
| Positive affect: Positive affect is given by the average of individual yes or no answers for three questions about emotions experienced or not on the previous day: laughter, enjoyment, and learning or doing something interesting |
| Negative affect: is given by the average of individual yes or no answers about three emotions experienced on the previous day: worry, sadness, and anger. |
| Confidence in national government: is given by the average of individual yes or no answers to the question: “Do you have confidence in the national government?” |
Data wrangling
Regions excluded to be able to carry out the analysis:
- Commonwealth of Independent States
- East Asia
- Middle East and North Africa
- South Asia
- Southeast Asia
- Sub-Saharan Africa
Missing data: as a complete set of data is needed for the analysis, it was decided to fill in missing data with the average of the variable where the data was missing.
Descriptive Analysis
| Variable | Min. | 1st Qu. | Median | Mean | 3rd Qu. | Max. |
|---|---|---|---|---|---|---|
| Life Ladder | 5.108 | 6.005 | 6.434 | 6.420 | 6.865 | 7.794 |
| Log GDP per capita | 8.575 | 9.805 | 10.358 | 10.224 | 10.732 | 11.545 |
| Social support | 0.7019 | 0.8496 | 0.8908 | 0.8830 | 0.9291 | 0.9799 |
| Healthy life expectancy at birth | 63.60 | 66.83 | 69.15 | 68.98 | 71.25 | 72.90 |
| Freedom to make life choices | 0.5740 | 0.7926 | 0.8386 | 0.8304 | 0.8909 | 0.9632 |
| Perceptions of corruption | 0.1727 | 0.5458 | 0.7644 | 0.6885 | 0.8614 | 0.9337 |
| Positive affect | 0.5538 | 0.6579 | 0.7163 | 0.7070 | 0.7516 | 0.8344 |
| Negative affect | 0.1161 | 0.2200 | 0.2670 | 0.2681 | 0.3060 | 0.4072 |
| Confidence in national government | 0.1759 | 0.3030 | 0.4032 | 0.4406 | 0.5933 | 0.8378 |
Highest values
| Variable | Country |
|---|---|
| Life ladder | Finland |
| log GDP per capita | Ireland |
| Social support | Iceland |
| Healthy life expectancy | Switerzland |
| Freedom to make life choices | Finland |
| Perception of corruption | Croatia |
| Positive affect | Panama |
| Negative affect | Brazil |
| Confidence in national goverment | Switerzland |
Lowest values
| Variable | Country |
|---|---|
| Life ladder | Venezuela |
| log GDP per capita | Honduras |
| Social support | Albania |
| Healthy life expectancy | Bolivia |
| Freedom to make life choices | Greece |
| Perception of corruption | Denmark |
| Positive affect | Albania |
| Negative affect | Kosovo |
| Confidence in national goverment | Venezuela |
Outliers
Outliers affect the correlation, so we want to detect and exclude them.
In order to detect outliers the Mahalanobis distance is to be used, for it we need:
- Covariance calculation
- Average of all quantitative columns of the dataframe
To discover the significance level associate to each variable we need to calculate the cumulative chi square density, where it is =<0.10 it could be an outlier.
Possible outliers
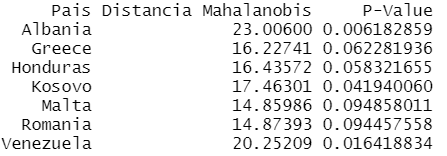
- Highlighted in red: possible outliers countries.
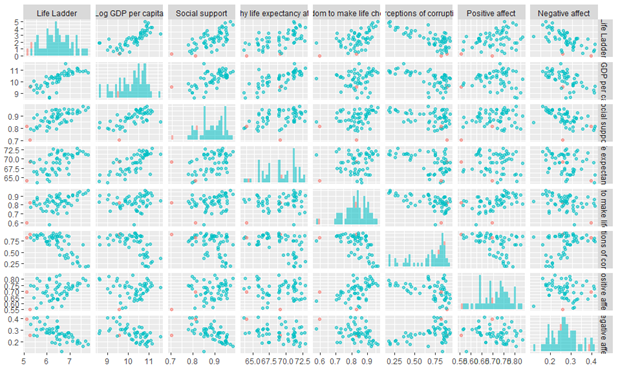
Kosovo, Venezuela and Albania are outliers, so they are to be excluded from the data and therefore from the analysis.
- Standardize the data (z-score)
- Correlation matrix (using the Pearson test), where the correlation matrix and the identity matrix are compared.
Cluster Analysis
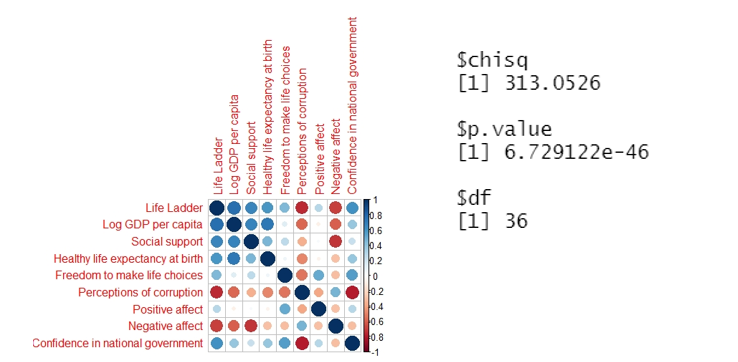
Since the p-value is very low (<0.05), there is no proof to say that the correlation matrix is the same as the identity matrix. The variables are correlated so we can go on with the analysis.
Number of clusters
Methods used:
- Average method (with euclidean distance);
- Complete method (with euclidean distance);
- Ward method (with euclidean distance);
- Gap statistics;
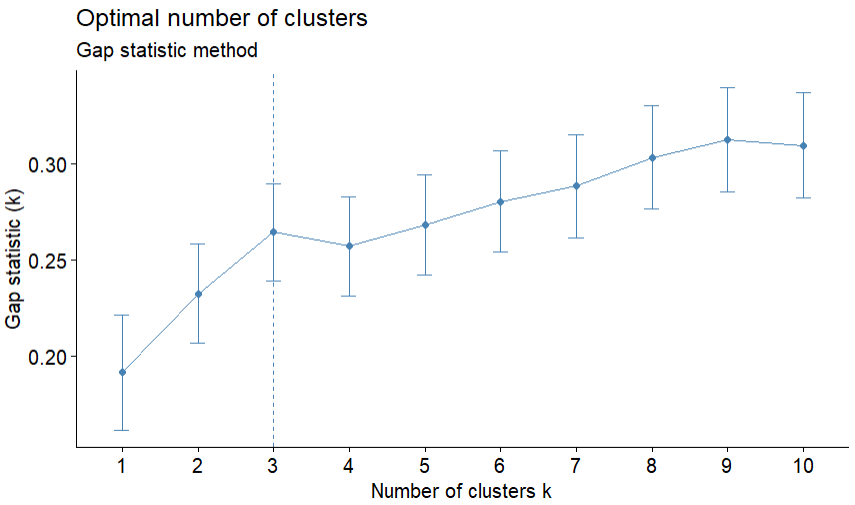
- Silhouette method;
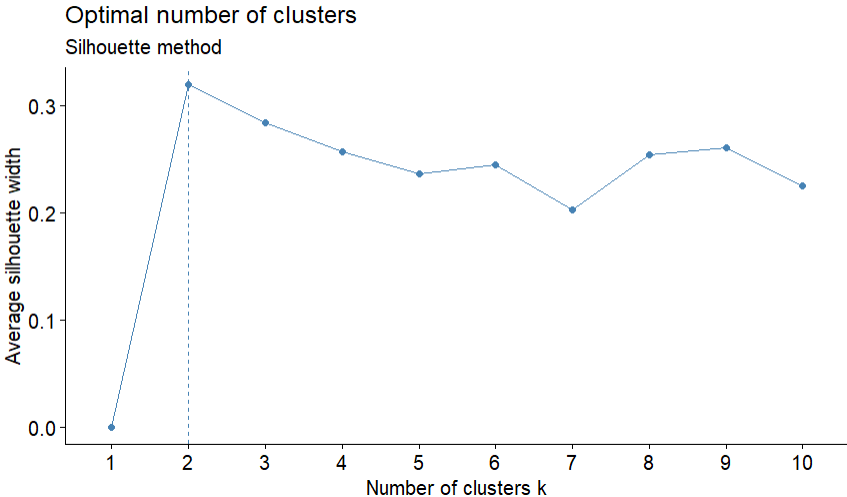
- With the function “NbClust”, have also been used: Elbow, Ch, DB, Duda, Pseudot2, Ratkowsky, Mcclain, SDindex and Mixture (EVE) methods.
Result: 50% of methods recommend 2 clusters and 50% recommend 3 clusters.
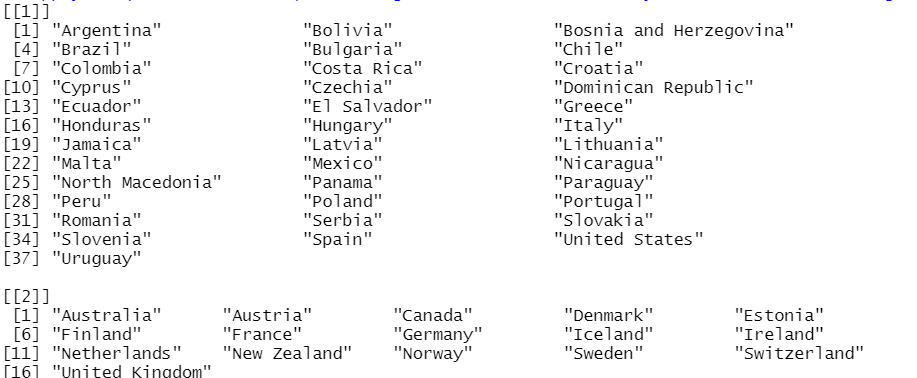
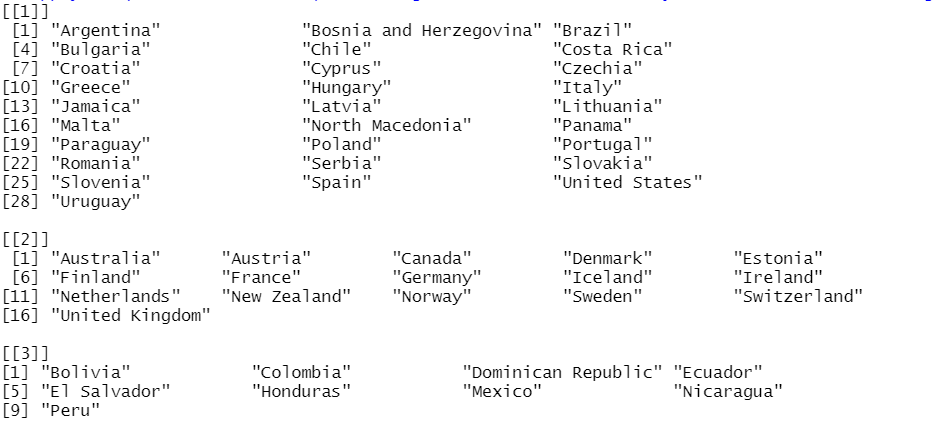
The countries were then split into two and three groups, so to see which division was more reasonable.
Two clusters
Three clusters
Hierarchical Analysis
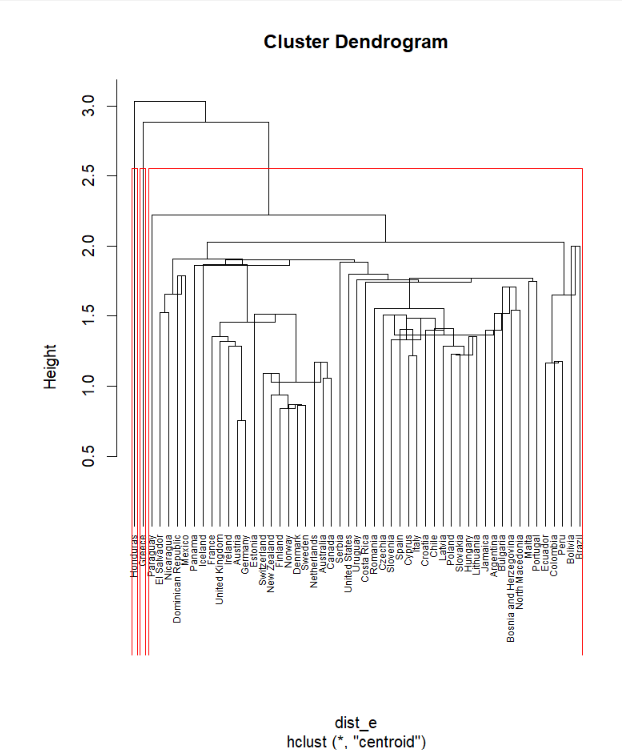
The euclidean distance is calculated in order to proceed with the following methods:
• Centroid method (depending on distance from the center)
 • Complete method (vecino más lejano)
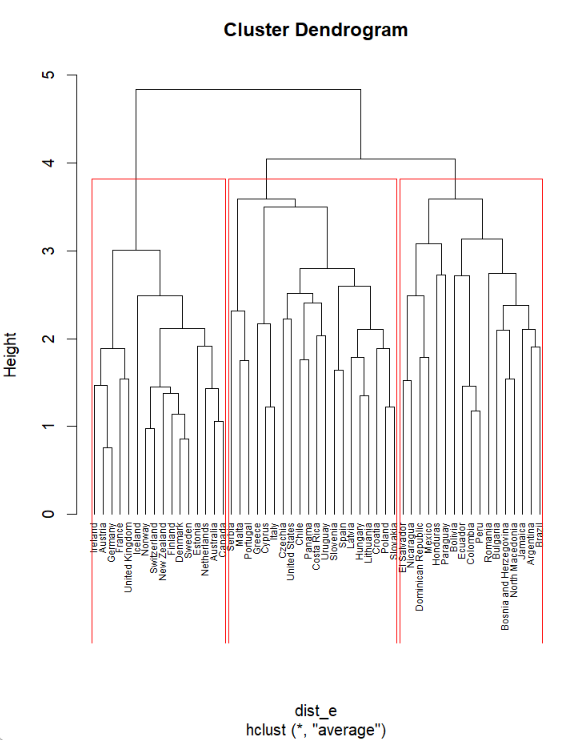
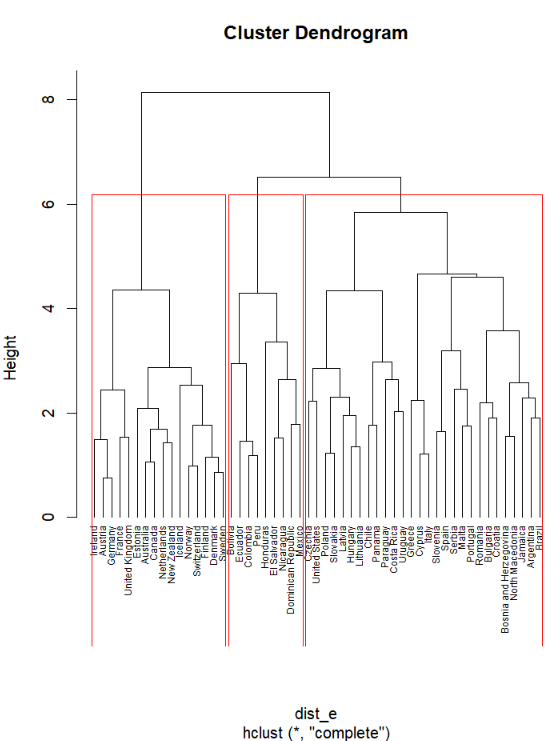 • Average method (vecino más cercano)
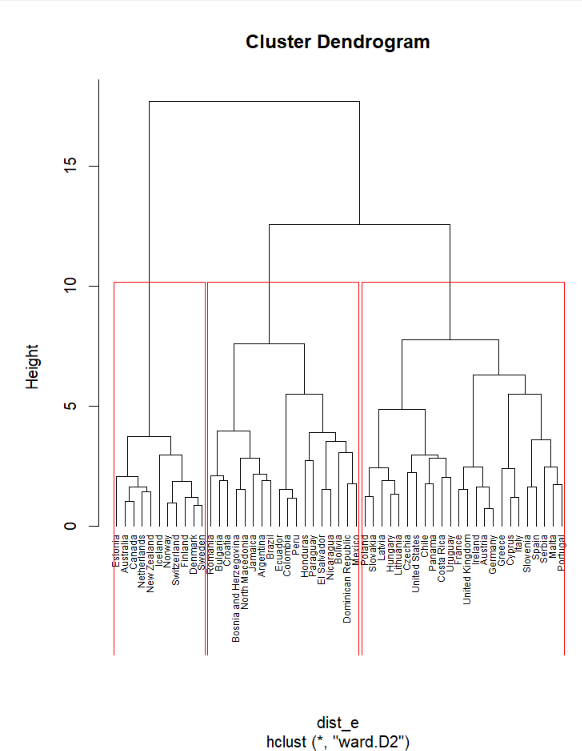
 • Ward method (usually creates groups of similar size, uses variance not distance)
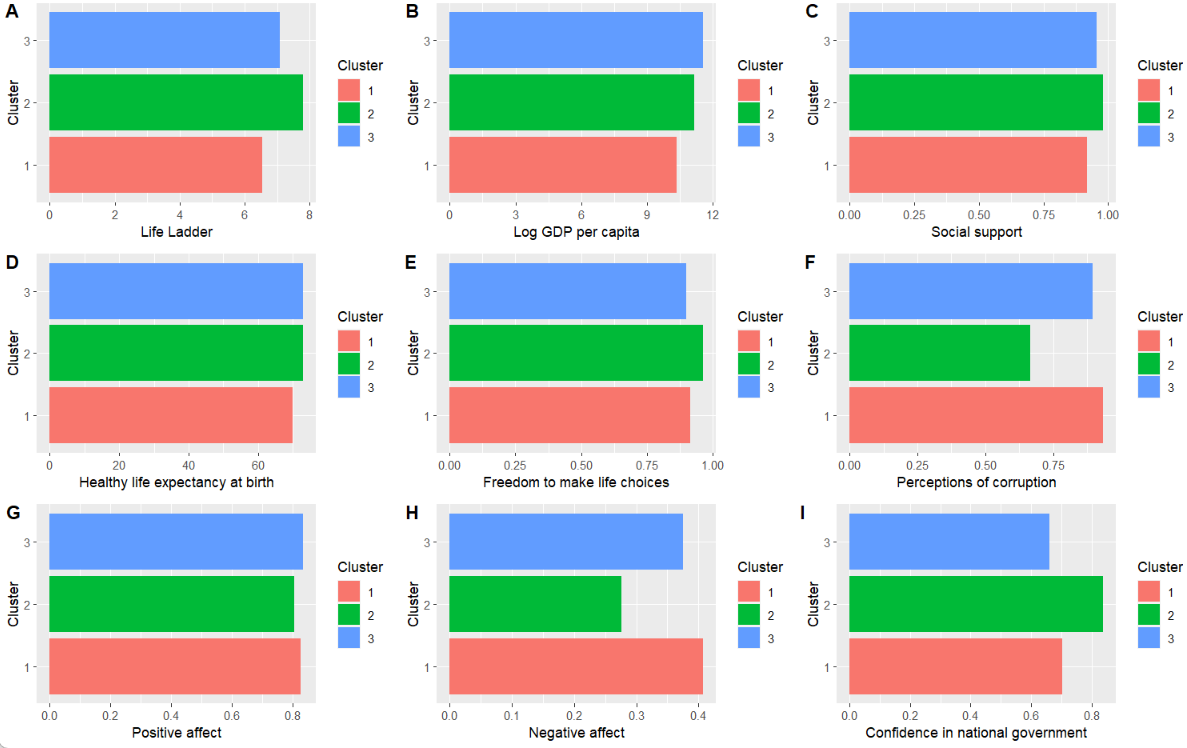
Overview of the three clusters by the Ward method (average values)
Non-Hierarchical Analysis
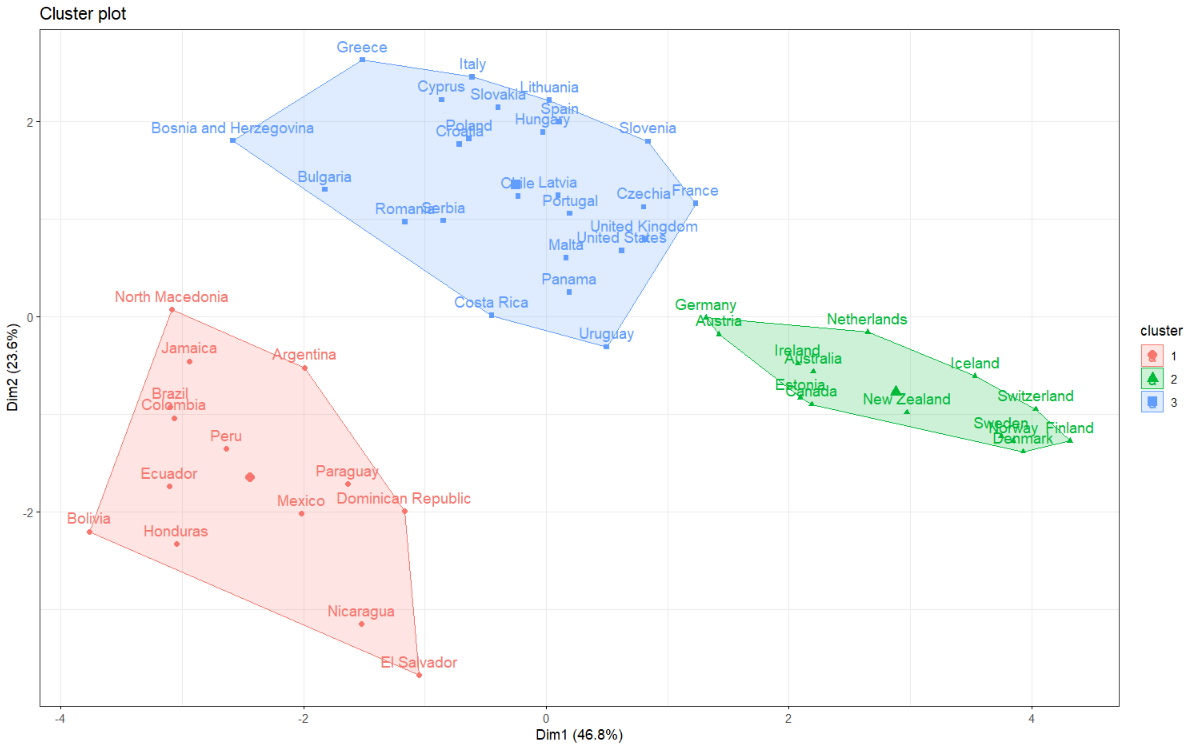
Based off the grouping made with the Ward method the center of each cluster, the centroid, is calculated with the mean of each variable. This is needed to do the k-means analysis.
| Group | Life Ladder | Log GDP per capita | Social support | Healthy life expectancy at birth | Freedom to make life choices | Perceptions of corruption | Positive affect | Negative affect | Confidence in national government |
|---|---|---|---|---|---|---|---|---|---|
| Red (1) | -0.98 | -1.08 | -0.97 | -0.96 | -0.05 | 0.62 | 0.05 | 0.75 | -0.49 |
| Green (2) | 1.35 | 0.95 | 1.01 | 0.90 | 1.12 | -1.51 | 0.72 | -1.10 | 1.21 |
| Blue (3) | 0.11 | 0.37 | 0.27 | 0.31 | -0.48 | 0.23 | -0.37 | -0.06 | -0.19 |
K-Means with final centroids scatterplot
One-way ANOVA test
- Chosen as there are 3 clusters.
- To determine if there is a meaningful difference between the average of the variables, as it is needed to refuse the H0 that all averages are the same.
- Compare the variance in the average of each variable.
| Life Ladder | Log GDP per capita | Social support | Healthy life expectancy at birth | Freedom to make life choices | Perceptions of corruption | Positive affect | Negative affect | Confidence in national government |
|---|---|---|---|---|---|---|---|---|
| 1.74e-13 | 2.72e-16 | 5.39e-09 | 1.28e-08 | 0.00054 | 1.46e-15 | 0.000329 | 1.41e-07 | 1.47e-08 |
As the p-value is very low in each case (<0.05), we can refuse the null hipothesis.
Conclusion
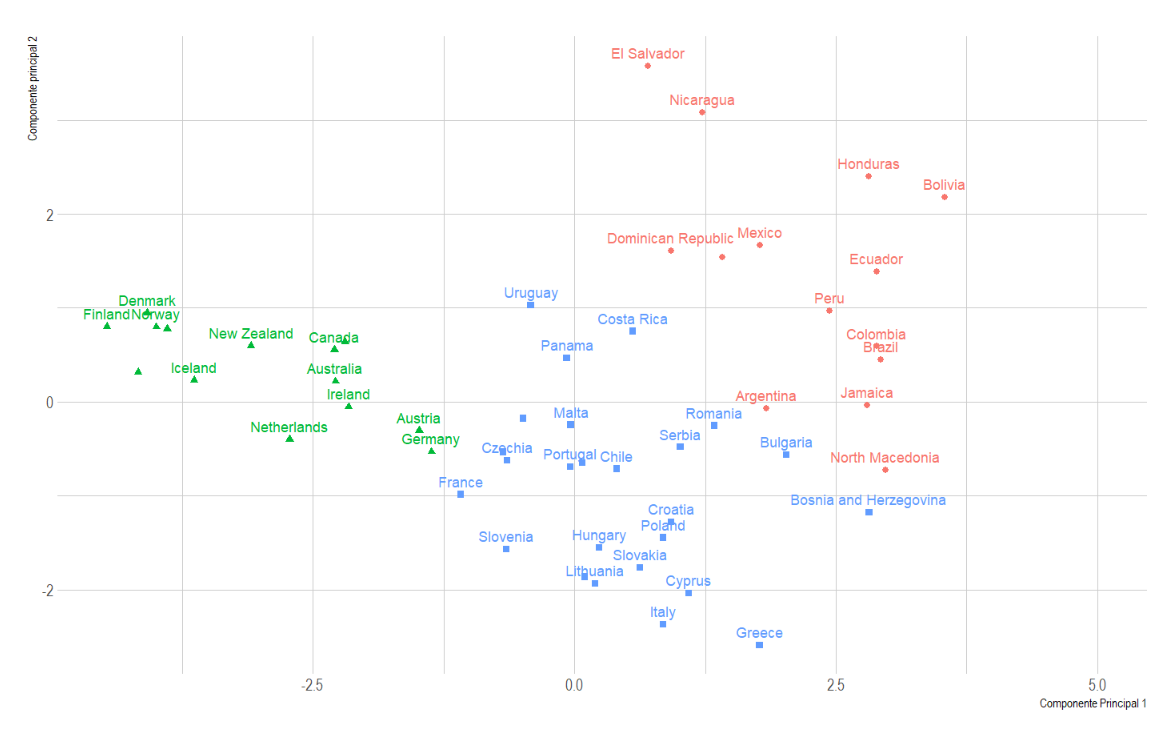
To show the result of the clustering, the countries are grouped in three principal components.
x= cp1, y= cp2, z=cp3
| Cluster | Life Ladder | Log GDP per capita | Social support | Healthy life expectancy at birth | Freedom to make life choices | Perceptions of corruption | Positive affect | Negative affect | Confidence in national government |
|---|---|---|---|---|---|---|---|---|---|
| Red | 5,82 | 9,36 | 0,83 | 66,36 | 0,83 | 0,79 | 0,74 | 0,33 | 0,40 |
| Green | 7,21 | 10,92 | 0,92 | 71,34 | 0,90 | 0,36 | 0,75 | 0,21 | 0,64 |
| Blue | 6,40 | 9,53 | 0,90 | 69,31 | 0,80 | 0,80 | 0,68 | 0,27 | 0,36 |