Table of Contents
Introduction
Language used: Python
Goal: Prediction of house prices.
Data used: Dataset from Properati website (https://www.properati.com.ar/). Two datasets: one for training (dataframe: dfef) and one for testing (dataframe: dfp)
Link to the Dataset: https://www.kaggle.com/datasets/jluza92/argentina-properati-listings-dataset-20202021/data (1gb)
Libraries used
| Library | Description |
|---|---|
| pandas | Data manipulation and analysis to work with structured data |
| numpy | For numerical operations to work on large and multi-dimensional arrays and matrices |
| sklearn | used for machine learning algorithms for classification, regression, clustering, dimensionality reduction |
| matplotlib.pyplot | Plotting library to create visualizations |
| seaborn | Statistical data visualization tool for informative statistical graphics |
Variables:
| Variable | Description |
|---|---|
| start_date | start date of the ad (2019-2020) |
| end_date | end date of the ad (2019-2020) |
| created_on | creation of the ad (2019-2020) |
| lat | latitude |
| lon | longitude |
| l1 | country where the house is located |
| l2 | region where the house is located |
| l3 | neighbourhood where the house is located |
| l4 | area of the neighbourhood where the house is located |
| rooms | Number of rooms |
| bedrooms | Number of bedrooms |
| bathrooms | Number of bathrooms |
| surface_total | total surface of the house |
| surface_covered | surface of the house (excluding balcony) |
| price | price |
| currency | price currency |
| title | title of the ad |
| description | description of the property |
| property_type | type of housing offered |
Data wrangling
Values to be predicted are in dfp dataframe.
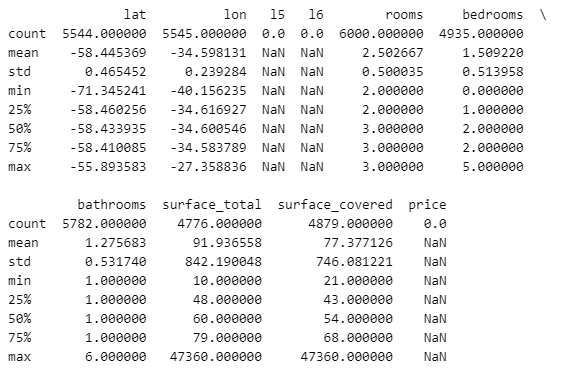
Summary of numeric variables values in the testing dataframe (dfp)

The focus is on properties in Capital Federal (Buenos Aires) and the southern area (GBA Zona Sur), specifically flats and penthouses for sale in USD.
In the training dataframe (dfef), only properties meeting the criteria in dfp and having a non-null price are considered. Irrelevant columns, such as empty or single-valued ones, are dropped.
In both dataframes, unique neighborhood names are identified. We then search for these names in the “title” and “description” columns. If found and the “Neighbourhood” column is empty, it is filled with the discovered value.
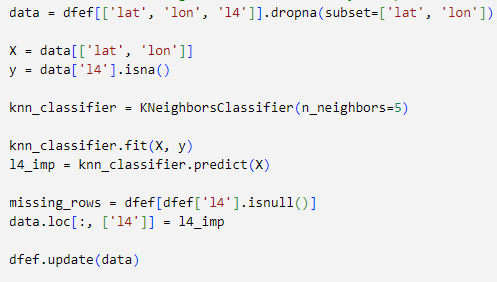
To handle remaining missing values in the “Neighbourhood” (l4) column, a KNN classifier is applied based on longitude and latitude.

To address missing values in the columns the following is used:
- bedrooms: the number of rooms minus 1 (deducting the bathroom).
- bathrooms: the number of rooms minus the bedrooms.
- total_surface: same as the value covered_surface, if available.
- covered_surface: same as the value total_surface, if available.
Following this, KNN Imputer is utilized to handle missing values in latitude, longitude, covered_surface, and total_surface.
With no missing values in longitude and latitude, the nan values for Neighborhoods are imputed with KNN classifier as with longitude and latitude the neighbourhood can be identified.
Additionally, an array is constructed with keywords associated with luxurious apartments.
palabras_clave = ['parrilla','balcon', 'patio','pileta', 'piletas', 'piscinas', 'gym', 'piscina', 'seguridad', 'subte', 'metrobus', 'terraza', 'jardin']
These words are searched in the ’title’ and ‘description’ columns. If they are present, in the new ’luxury’ column is assigned a value of 1; otherwise, it receives a 0.
Each neighborhood corresponds to a ‘Comuna’. Using another array, a new ‘Comuna’ column is created to associate each neighborhood with the correct Comuna.
A ‘median_price’ column is added by grouping the columns ’neighbourhood’, ‘rooms’, ‘bedrooms’, ‘bathrooms’ and ‘property_type’ and calculating the median price value for each group. Missing values are addressed by employing a KNN Classifier for imputation.
Model
Dataframes are filtered to contain only numeric columns. Categorical columns are converted to dummies.
Features Selection
For regression models, the assumption is that the variables are indepdent, that means not dependent on others. To check this, correlation is tested and only variables with p-values > 0.60 are included.
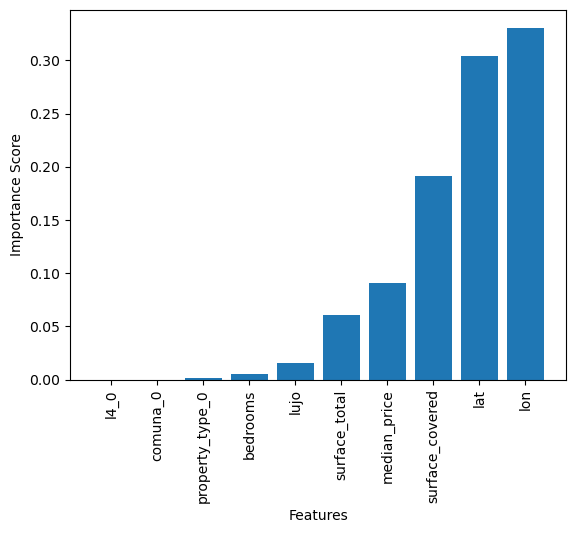
Importance Score

The most important variables chosen by the model (lon, lat, surface_covered, median_price) in addition to variable “luxury” (as better results are obtained), are used for the prediction.
After trying different models and comparing the related mean squared error, it is considered that the ensamble Random Forest Regressor model provides the best accuracy. It is then applied to the training dataset and then to the testing dataset to get the predictions.